
A More Realistic Approach to Self-improvement: Understanding Individual Variation
Many self-improvement recommendations ignore a key reality: what works for one person may not work for another. This article argues that recognizing individual variation leads to a more realistic and effective approach to personal growth.
In this Article...
F
G
A More Realistic Approach to Self-Improvement
If you have been consuming content on personal development for a while, you have probably noticed that gurus tend to recommend either:
-
What has worked for them.
-
What has worked on average in scientific research.
They might sometimes share success stories from their clients. But they rarely talk about cases where their recommendations did not work.
This is understandable from a commercial perspective. After all, a product or service is more appealing when its benefits are presented clearly. If you start emphasizing variation in results, those benefits become uncertain—and therefore harder to sell.
The truth, however, is that there is no single self-improvement strategy that works equally well for everyone. Each individual—and each life situation—is different. Moreover, many factors beyond the specific tools we use influence the outcomes of our self-improvement efforts.
The aim of this article is to outline a more realistic approach to self-improvement by explaining the role of individual variation in outcomes. Rather than speaking in abstract terms, I will use data from a study I reviewed previously on how acting on values improves well-being and life satisfaction. This will directly illustrate individual variation—and show you how to interpret it in practice.
At the end of the article, I will also explain how you can test whether a given recommendation actually works for you.
Acting on Values as an Example
In a previous article, I reviewed the results of an Acting on Values intervention. Participants received values training and were encouraged to act on their values over 4 weeks.
This group was compared with:
-
A mindfulness group that received mindfulness training and practiced meditation
-
A control group, who continued their lives as usual
Measures of well-being and life satisfaction were collected before and after the intervention. The results showed that both acting on values and mindfulness improved people’s levels of well-being and life satisfaction, while the levels hardly changed for the control group.
The graph I originally used to present the results looked like this:
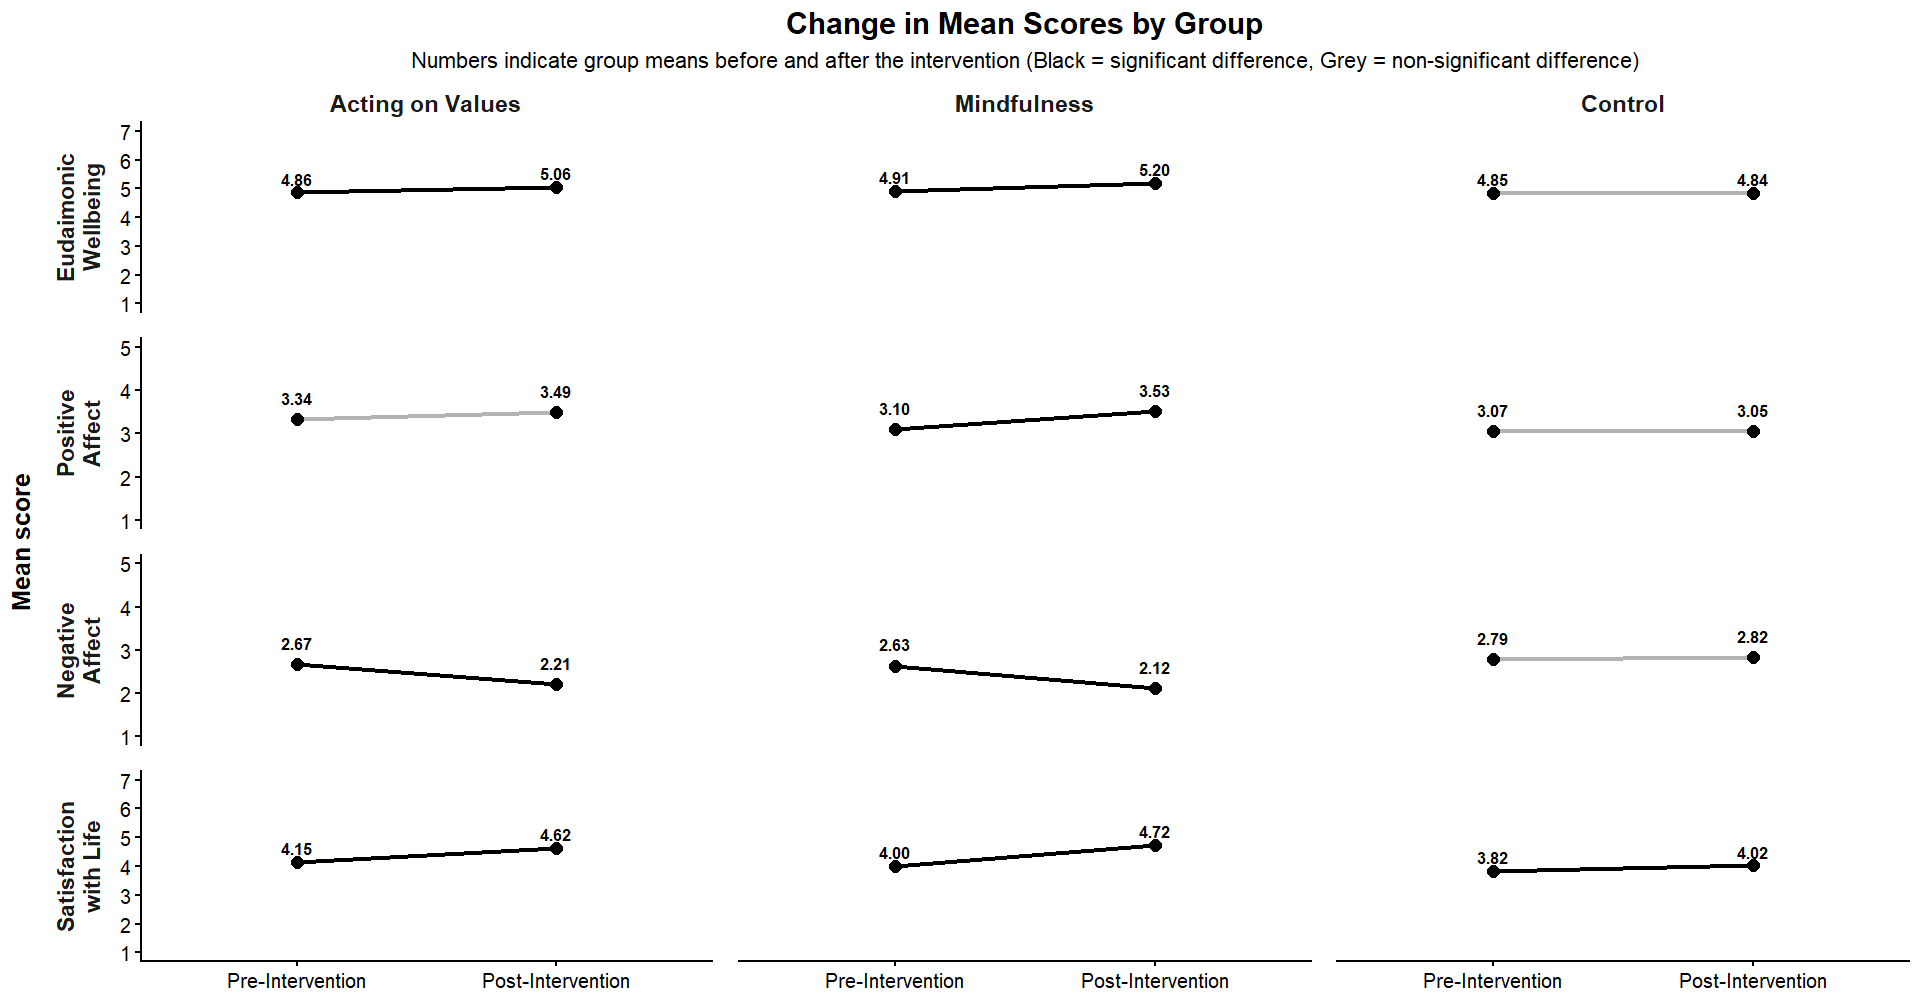
As you can see, it shows average scores across four measures for each group before and after the intervention. I presented it this way to reduce readers’ cognitive load.
However, I firmly believe that it is important for readers to understand individual variation in results, as this offers more realistic expectations about what psychological interventions can achieve. After all,
the reader is likely less interested in whether an intervention works on average than in whether it will work for them.
With this context in mind, let’s now explore the individual variation of results and discuss what drives these differences.
Individual Variation in Life Satisfaction
The graph below shows individual trajectories for life satisfaction. Each participant’s pre- and post-intervention scores are represented by dots connected by lines in grey, while group means are shown in black.
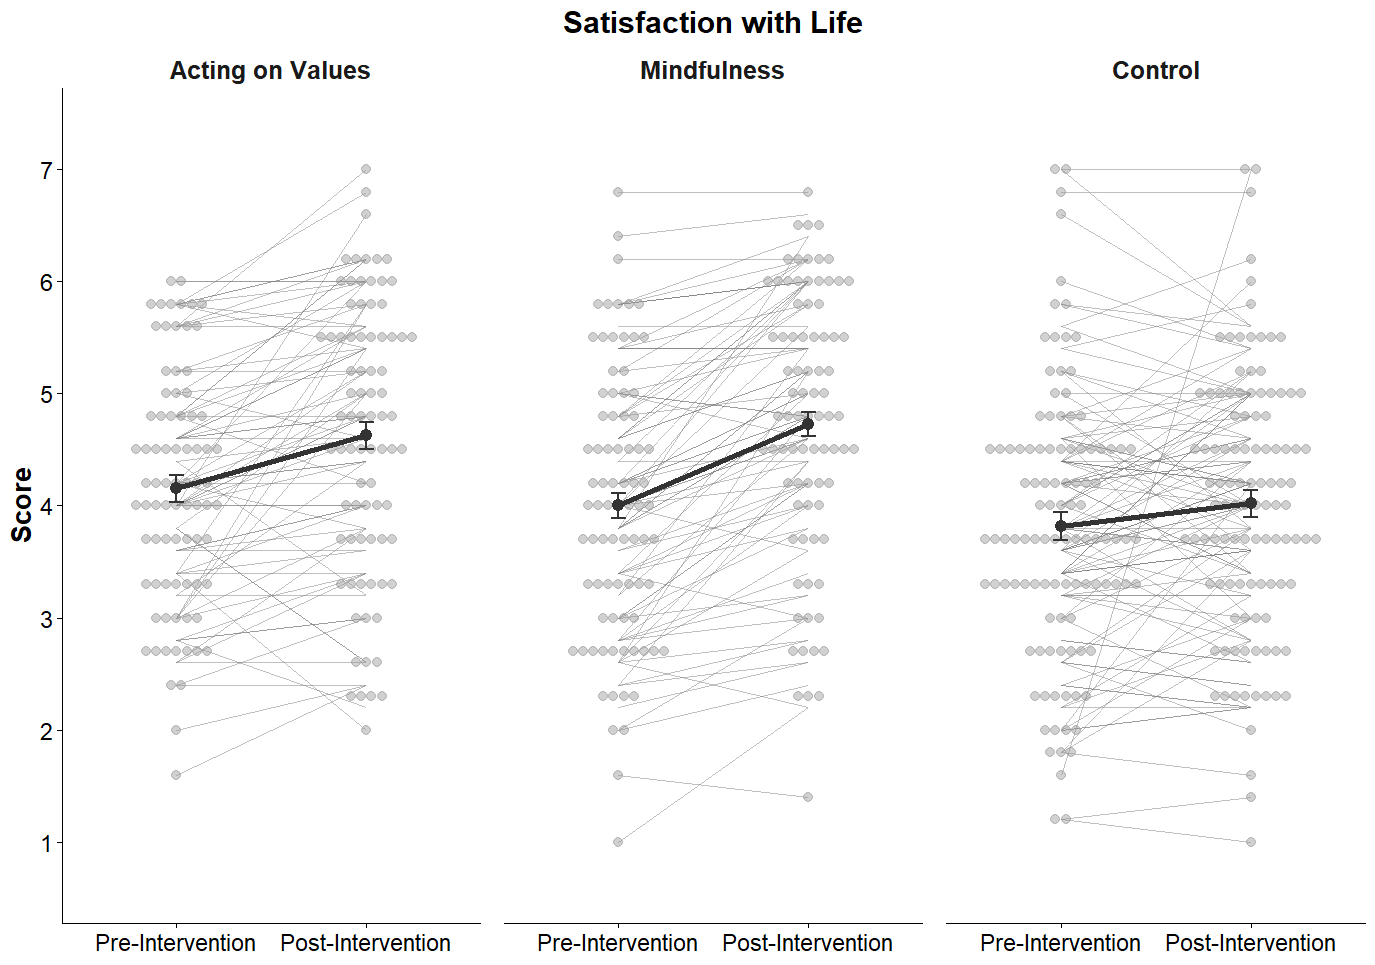
The first thing you will notice is that individuals improved, worsened, or remained stable across all three groups.
This is perfectly normal because
the study was conducted “in the wild.” Participants were living their lives while engaging with the intervention. As a result, many factors beyond the intervention influenced the outcomes.
For example, both positive events (e.g., a visit from a friend) and negative events (e.g., a flight cancelation) may have affected participants’ life satisfaction.
The control group illustrates this particularly well. Among the four participants with the highest pre-intervention scores, two remained at similarly high levels, while two declined slightly but remained well above the mean.
Among the three participants with the lowest pre-intervention scores, two remained at similarly low levels, while one moved from the bottom to the top. Importantly, this change occurred without any intervention, meaning it cannot be attributed to the training.
Two key processes help explain these patterns. First, scores reflect temporary fluctuations (e.g., changes in mood, context, or life events). When someone scores very high or very low at a given moment, part of that extremeness is often due to these temporary factors. When measured again, scores tend to move closer to the average. This is known as regression to the mean in statistics.
Second, the scale itself imposes limits: the minimum score is 1, and the maximum is 7. People who already score very high have little room to improve, while those who score very low have limited room to decline further. These constraints can amplify patterns consistent with regression to the mean.
Importantly,
these effects (regression to the mean and scale limits) explain why personal experience can be misleading if taken in isolation. If you try something when you are at a low point, you are more likely to improve regardless of what you do.
But… Individual Variation Is Not Random. There Are Tendencies.
So far, I have focused on individual data points without paying close attention to the tendencies. It is not my intention to inflate a nihilistic perspective of scientific research. So, let’s look at the tendencies now.
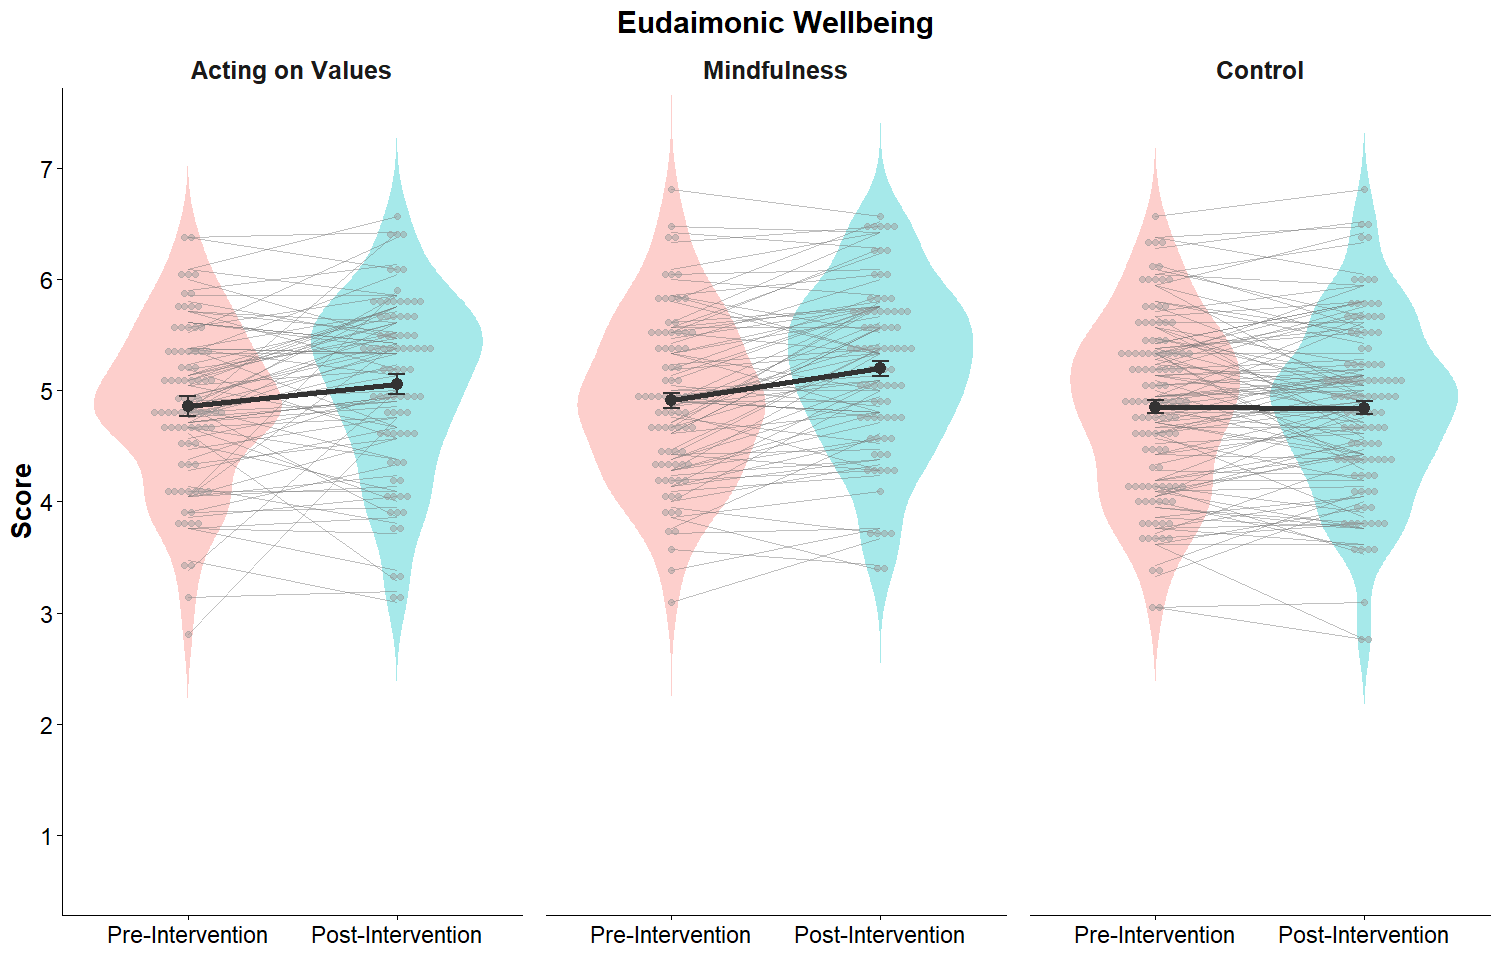
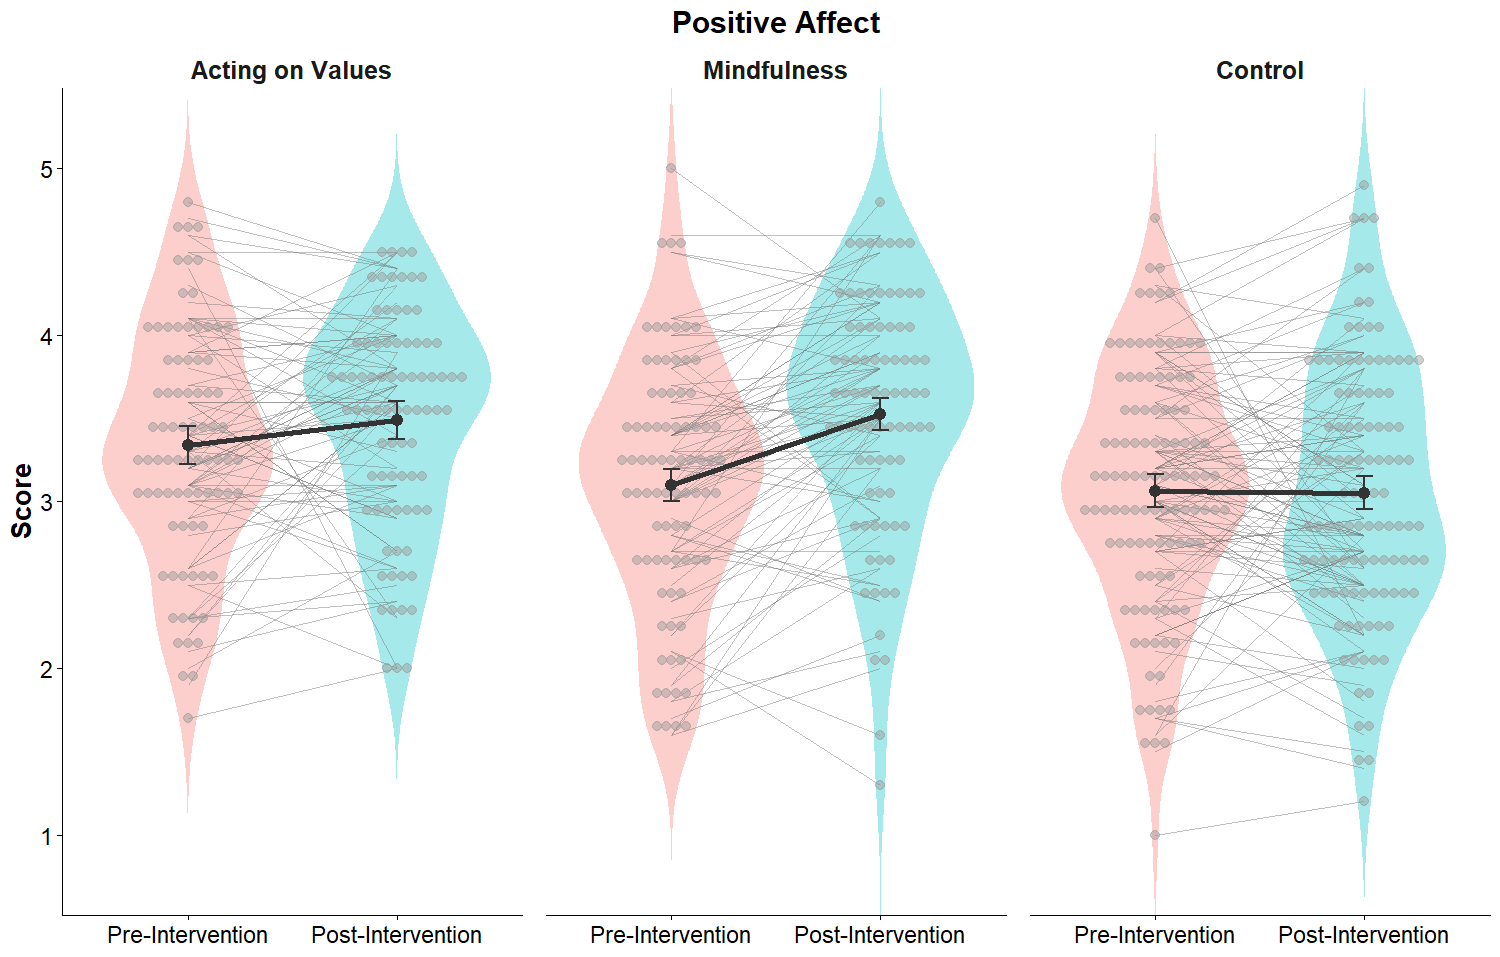
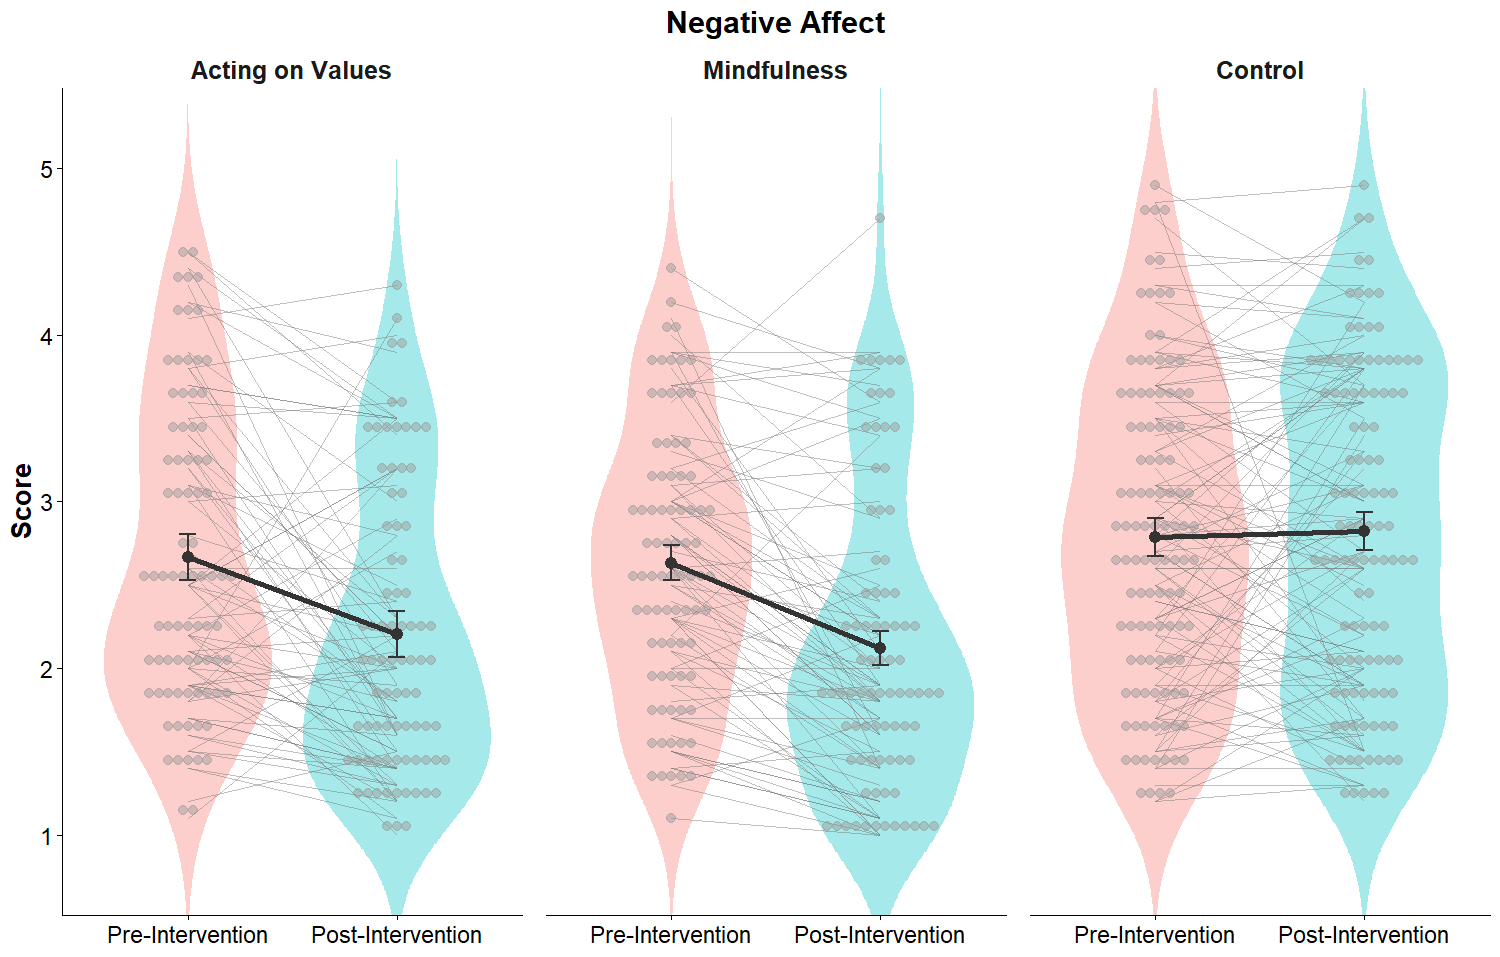
The graph below is called a violin plot because it resembles a violin. You can see that the violin widens at points with a higher concentration of participants and narrows where fewer participants are present.
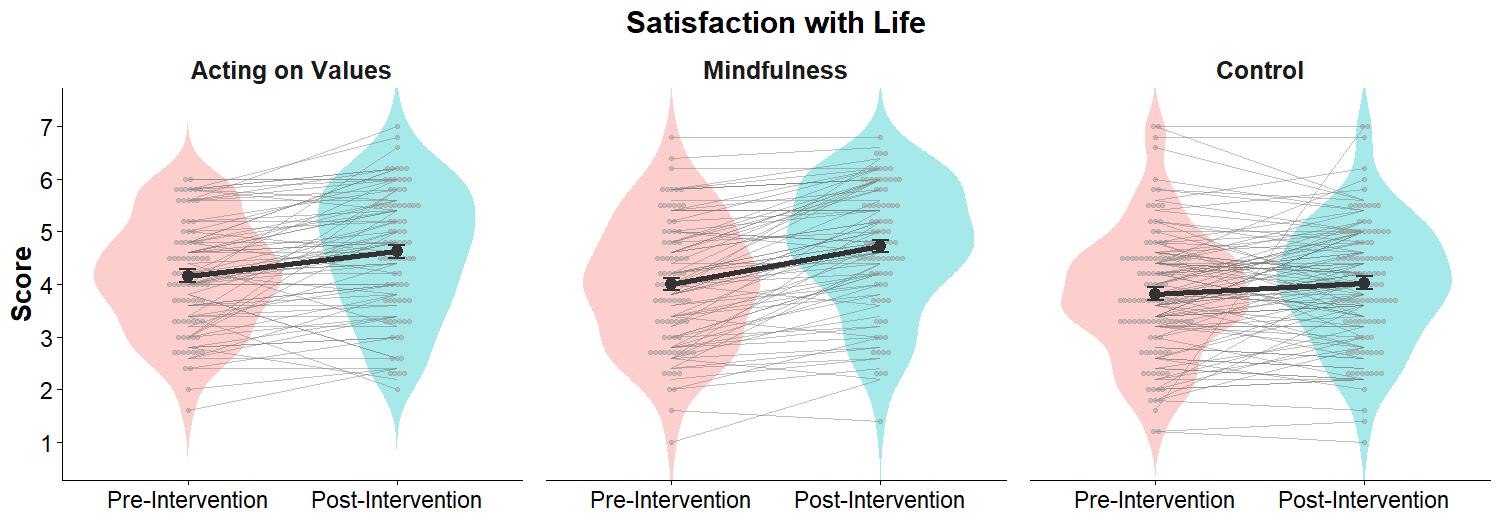
In the control group, the shape changes very little from pre- to post-intervention. Although regression to the mean and scale effects are present, they do not substantially alter the overall distribution.
In contrast, the distributions for the Acting on Values and Mindfulness groups clearly shift upward. Before the intervention, scores are concentrated around the middle. After the intervention, they become more concentrated at higher levels.
Because these distributions shift upward in both intervention groups—while remaining stable in the control group—we can conclude that, beyond random fluctuations, the interventions produced a genuine improvement at the group level.
Now you have the tools to interpret the remaining graphs yourself. See figures at the end of the article.
How Can You Know Whether an Intervention or Recommendation Works for You?
So far, we have seen that:
-
Both Acting on Values and Mindfulness improve well-being on average.
-
Random fluctuations also play a role.
This raises an important practical question:
How can you know whether an intervention or recommendation works for you?
A useful approach is to run an ABAB self-experiment. This is a type of self-experiment with repeated measures in which you take measures (A) without systematically changing anything in your life, and (B) when you intentionally change something. An ABAB self-experiment looks like this:
-
Week 1: Baseline (A) — just measure the outcomes of interest
-
Week 2: Intervention (B) — do the action you are testing and measure again
-
Week 3: Baseline (A) – stop doing the action and measure
-
Week 4: Intervention (B) – do the action again and measure
This design allows you to observe whether changes in your well-being or any other measure of your interest consistently align with your actions. You would expect an improvement in B periods in comparison with A periods.
If results are unclear after two AB cycles, you can extend the experiment with additional cycles.
Here is an example of how the results of an ABAB self-experiment would look.
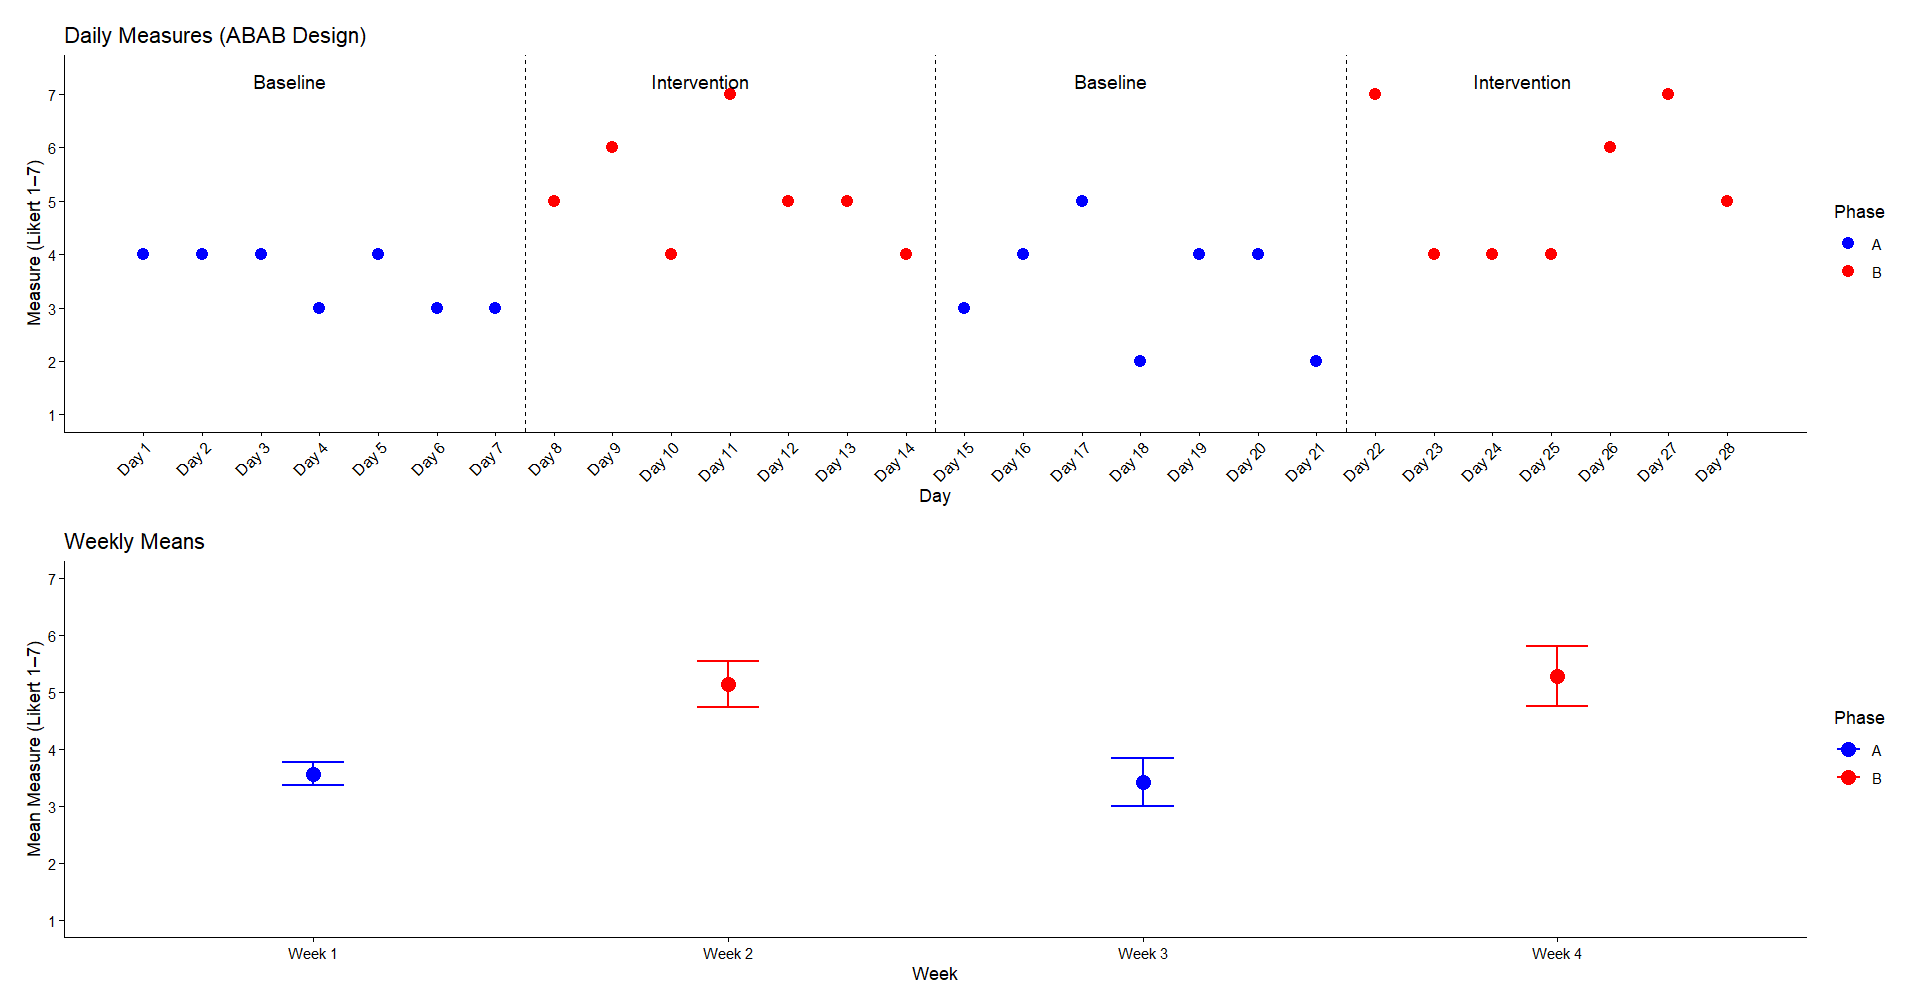
Note that the graphs contain simulated data created for educational purposes.
You can see that the self-experiment lasts 4 weeks, one week for each A or B period. However, measures are being taken each day. The advantage of taking multiple measures for each A or B period is that it may help us to reduce the effects of temporal fluctuations in our analysis. The top graph shows the raw data, while the bottom graph shows the average data for each week.
If these were the results of a self-experiment, we would conclude that the intervention is beneficial: the measured levels are higher in B periods than in A periods.
Conclusion
In this article, I have shown that temporary fluctuations beyond the effects of an intervention or action to improve well-being occur, indicating that results are not the same for everyone. I have also explained how to interpret individual variation in intervention outcomes and how to test whether any intervention or recommendation works for you personally.
If you have any questions, feel free to reach out through the contact form.
Appendix: Additional Figures Showing Individual Variation in Well-being
About the Author
Ángel V. Jiménez is passionate about intentional living, scientific psychology, and the analysis of human behavior from an evolutionary perspective. He earned his PhD at the University of Exeter (UK), where he studied processes of status acquisition and interpersonal influence, with particular emphasis on the role of prestige in social learning. After completing his doctorate, he conducted postdoctoral research at Brunel University London and the University of Exeter. He currently teaches research methods for psychology.
Through this website, he shares practical, research-informed, and reflective content on intentional living and psychology, helping readers better understand human nature and make more deliberate choices in an increasingly complex and distracted world.

References
These are the materials consulted to prepare this article. Interested readers can review them to delve deeper into the topics discussed.
Blog Posts
Jiménez, ÁV (2026). How Acting on Values Improves Well-being and Life Satisfaction. Incomparable.
Scientific Articles
Bojanowska, A., Kaczmarek Ł, D., Urbanska, B., & Puchalska, M. (2022). Acting on Values: A Novel Intervention Enhancing Hedonic and Eudaimonic Well-Being. Journal of Happiness Studies, 23(8), 3889-3908. https://doi.org/10.1007/s10902-022-00585-4
Kirk, R. (2017). ABAB Research Design. In The Sage Encyclopedia of Abnormal and Clinical Psychology (Vol. 7, pp. 1-2). SAGE Publications, Inc., https://doi.org/10.4135/9781483365817.n8
Morton, V., & Torgerson, D. J. (2005). Regression to the mean: treatment effect without the intervention. Journal of Evaluation in Clinical Practice, 11(1), 59–65. https://doi.org/10.1111/j.1365-2753.2004.00505.x
Roberts S. (2004). Self-experimentation as a source of new ideas: ten examples about sleep, mood, health, and weight. The Behavioral and Brain Sciences, 27(2), 227–287. https://doi.org/10.1017/s0140525x04000068
